2017 NBA Hackathon Application
sunday. november 11, 2017 • 6 mins
Since 2016, the National Basketball Association began hosting an annual NBA Hackathon! As a basketball aficionado and computer science student, I think sports analytics is an exciting Wild West part of the growing trend of information driven decision making. This past year, I submitted an application for the NBA application. As a part of the application, I had to design and compute answers for two different questions. Both were interesting brain teasers, and I thought I'd share my approaches to these problems in this post!
Q1: Probability of a Losing Streak
Prompt: Calculate the probability that the 2016-2017 Warriors will lose consecutive game. Assume that the probability the Warriors win a game is fixed at 80%.
Introduction
Before approaching the problem, there are a couple numbers required for contextualization. We assume that there are a total of 82 games in the NBA’s regular season. Given that there is a fixed 80% chance the Warriors win a single game, there would subsequently be a 20% chance they lose a game. The probability that the Warriors lose two games in a row would be (0.20)2 = 0.04 or 4% chance of losing two games in a row. However, this number by itself would not be enough to estimate the cumulative probability for two reasons:
-
The number of consecutive loses is not limited to two. Given n games and k losses, there are 'n choose k' ordered ways for the season of n games to k play out with k losses and n - k wins.
-
Given a fixed number of losses, there is a specific probability associated with each quantity of losses.
From these observations, this problem can be modeled as a binomial distribution. By definition, the binomial distribution is the discrete probability distribution of the number of successes given n consecutive experiments with a binary set of outcomes. The parameters n and p would respectively be the number of games and the probability of winning.
Computation
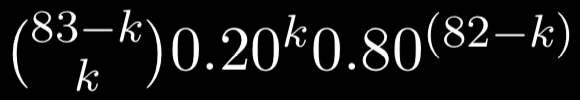
The formula for calculating the probability of a binomial distribution can be logically arrived upon. To calculate the probability of exactly k successes in n trials, the formula is:

With this formula, assuming that a ”success” is a loss and ”p” would be the probability of losing, we could calculate the probability losing k games given all possible orders of losing those games out of 82. However, in this question, we’re focusing on consecutive games.
An alternative approach would be to count the number of win-lose sequences that would not lead to two consecutive losses. Given 82 total games and k losses, there would be '83-k choose k' configurations that avoid consecutive losses. The logic starts with the assumption that given k losses, each loss must be followed by a win except the last game. From k - 1 losses, there would be 2k - 2 guaranteed games from above. There is one single game reflecting the final loss, and then 82 - (2k - 2) - 1 = 83 - 2k unassigned wins. Therefore, in total, there are (k - 1) + 1 + (83 - 2k) = 83 - k ”loss containing units” that we can choose losses from. In other words, '83-k choose k' choices.
Given the number of choices, we can apply the probability formula above as the following:
We would need to calculate all probabilities of k losses from 0 to 41 losses (given that more than 41 losses would guarantee consecutive losses). Therefore, we could take the summation of probabilities across these range of losses. The final equation would be the following:

As we can see, there is a 5.88% chance that the Warriors do not lose consecutive games. Therefore, I would conclude that it is highly unlikely the Warriors will not lose consecutive games during the regular season.
Q2: Playoff Contention Picture
Prompt: Given two spreadsheets, one containing team division / conference information and the other containing the outcomes of every game in the past season, output the playoff result for each team. For teams that made the playoffs, simply indicate so. For teams eliminated from the playoffs, state the date they were eliminated from playoff contention.
Introduction
My initial approach to the problem was defined by seeing which tools and which information was most useful. First and foremost, I decided to use Python because the Pandas library provides an absolutely fantastic grip on large data sets. My experience with Excel software is marred with crash reports, freezing, and unsaved progress so I decided not to proceed down that route.
The data given to answer the above question came in the form of an excel file with three sheets. The first sheet contained information about which conference and division each team was a part of. In the NBA, teams are split into two conferences and six divisions. Each conference contains fifteen teams, and each division contains five teams. Some teams are part of the same conference, but not necessarily the same division. The second sheet was a list of every regular season game during the 2016-2017 NBA season. Each row stored information about one game, including the day of play, home team, away team, final score, and winner of the game (denoted as home / away). The third sheet was simply a template of what the output was supposed to look like.
When looking at the three sheets and the information provided, I found some of the columns to be unnecessary. Given that the problem is asking for playoff elimination relative to conference, the 'division' column is not needed. In the ‘scores’ sheet, the final score is not required. We only care about the outcome, not the actual scores. After eliminating these columns from my data set, I had all the information required to tackle the problem: The team names, their respective conference membership, and the win/lose outcome of every regular season game.
Computation
All my computation was completed within a Jupyter notebook. I'll take this section to walk through my code and explain what I did each step of the way. First up is a list of some of the more helpful libraries I decide to use. Pandas and Numpy are pretty standard libraries to do data processing. The assortment of Plotly, Cufflinks and Matplotlib commands are graphing tools.
import pandas as pd
import numpy as np
from plotly import __version__
from plotly.offline import download_plotlyjs, init_notebook_mode, plot, iplot
import cufflinks as cf
%matplotlib inline init_notebook_mode(connected=True) cf.go_offline()
Before diving into the actual computation process, I cleaned up and reorganized some of the data. The rearrangement made it easier to perform data traversal later in the code. One cool feature of Pandas is the ability to perform multi-indexing aka setting and organizing multiple columns as indices for your table. Through multi-indexing, I was able to group games by the day they occurred. This made for an easier traversal process.
# Read excel data sheets in as Panda Tables
division_info = pd.read_excel("Analytics_Attachment.xlsx", sheetname="Division_Info")
scores = pd.read_excel("Analytics_Attachment.xlsx", sheetname="2016_17_NBA_Scores")

# For our purposes, the 'division' columns in division_info and 'Home Score', 'Away Score'
# columns in scores are unnecessary, so we will remove them.
division_info.drop('Division_id', axis=1, inplace=True)
scores.drop(['Home Score', 'Away Score'], axis=1, inplace=True)

# Adding Columns to 'Division Info' table to count wins, loses, and elimination date (by default set to "Playoffs")
division_info['Wins'] = 0
division_info['Losses'] = 0
division_info['Elimination Date'] = "Playoffs"

# Using a MultiIndex Pandas Dataframe, we group the games occurring on the same with each other to make traversal
# easier. The reason a 'Dummy' column is b/c multiple index groups are required.
scores['Game No.'] = range(0, scores['Date'].count())
scores.set_index(['Date', 'Game No.'], inplace=True)
Now that the data has been organized properly, we'll proceed to iterate through the table and make the appropriate modifications to the division_info table to reflect the correct answers. The general idea is to have an outer 'for' loop that iterates through every single date. We pull the games associated with each date and iterate through those, updating the 'division_info' table as we go. Then, we perform elimination calculation as follows: Find the eighth place team and the last place team that has not been eliminated yet. If the number of games left + last place team's wins is less than the eighth place team's wins, then the last place team is eliminated. If and when a team is eliminated, the day of the game in that iteration is registered under the 'Eliminate Date' column (created in line 13 in the previous code block).
# Iterating through the MultiIndex Dataframe by Date
for value in scores.index.get_level_values('Date').unique():
    currentDate = value.strftime('%Y-%m-%d') # Reformatting the date index value
    miniFrame = scores.xs(currentDate) # Returns cross section of data based on 'date' layer index

    # Iterate through all games that occurred on 'currentDate' and adjust records accordingly
    for index, row in miniFrame.iterrows():
        if (row['Winner'] == 'Home'):
            # Home Team Won, find matching home team and iterate wins, matching away team and iterate losses
            division_info.loc[division_info['Team_Name'] == row['Home Team'], 'Wins'] += 1
            division_info.loc[division_info['Team_Name'] == row['Away Team'], 'Losses'] += 1
        elif (row['Winner'] == 'Away'):
            # Away Team Won, matching home team +1 loss, team +1 win
            division_info.loc[division_info['Team_Name'] == row['Home Team'], 'Losses'] += 1
            division_info.loc[division_info['Team_Name'] == row['Away Team'], 'Wins'] += 1
        else:
            print("Error: Invalid 'Winner' Value")

    # Split teams into eastern and western conferences, sort by number of wins, limit to uneliminated teams
    eastern_Conference = division_info[(division_info['Conference_id'] == 'East') & (division_info['Elimination Date'] == "Playoffs")].sort_values(['Wins'], ascending=False)
    western_Conference = division_info[(division_info['Conference_id'] == 'West') & (division_info['Elimination Date'] == "Playoffs")].sort_values(['Wins'], ascending=False)

    # Find last place, non-eliminated team in each conference
    eastLast = eastern_Conference[eastern_Conference['Losses'] == max(eastern_Conference['Losses'])]
    westLast = western_Conference[western_Conference['Losses'] == max(western_Conference['Losses'])]

    # Find eighth place team (off by 1 indexing)
    eastEighth = eastern_Conference.iloc[[7]]
    westEighth = western_Conference.iloc[[7]]

    # Find maximum possible wins for last place team. If less than 8th place team's wins, they're eliminated
    maxWins = eastLast['Wins'].values[0] + (82 - eastLast['Wins'].values[0] - eastLast['Losses'].values[0])
    if (eastEighth['Wins'].values[0] > maxWins):
        division_info.loc[division_info['Team_Name'] == eastLast['Team_Name'].values[0], ['Elimination Date']] = currentDate

    maxWins = westLast['Wins'].values[0] + (82 - westLast['Wins'].values[0] - westLast['Losses'].values[0])
    if (westEighth['Wins'].values[0] > maxWins):
        division_info.loc[division_info['Team_Name'] == westLast['Team_Name'].values[0], ['Elimination Date']] = currentDate
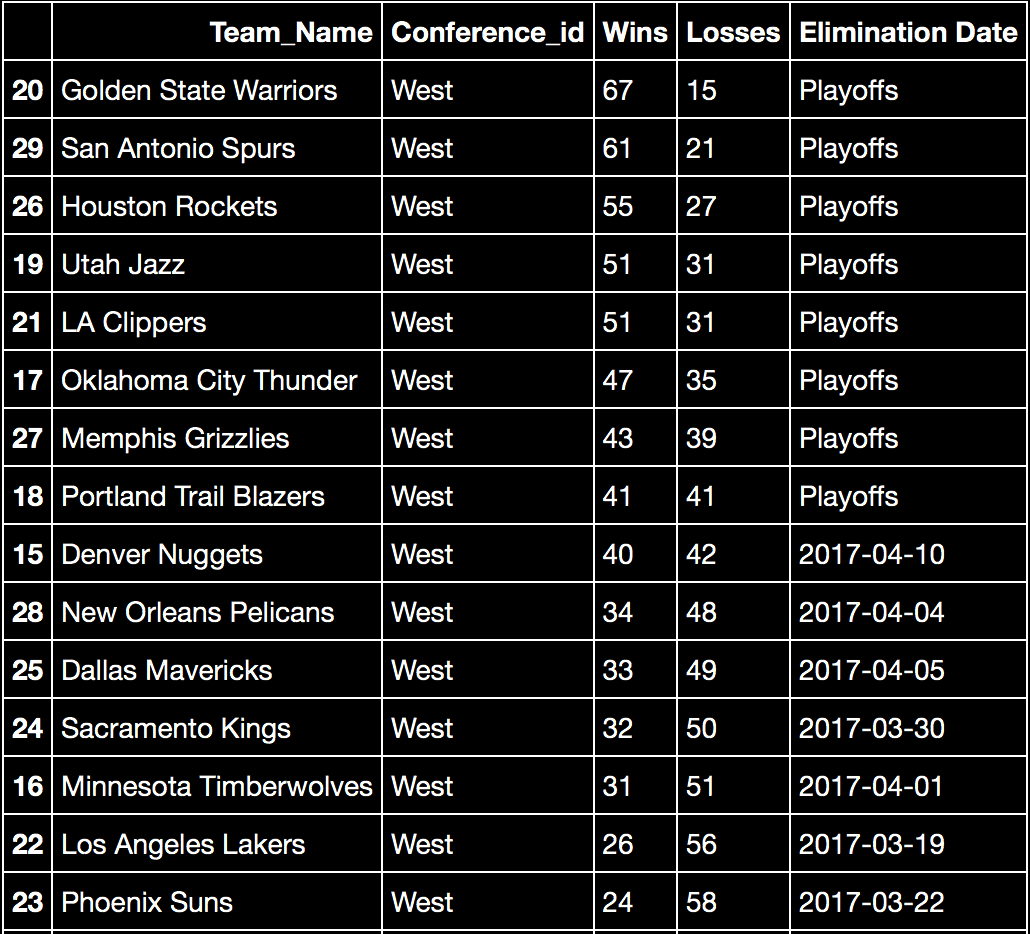
Here is a screenshot of the results for the Western Conference standings the code above generated:
And now, a screenshot of the Eastern Conference standings:
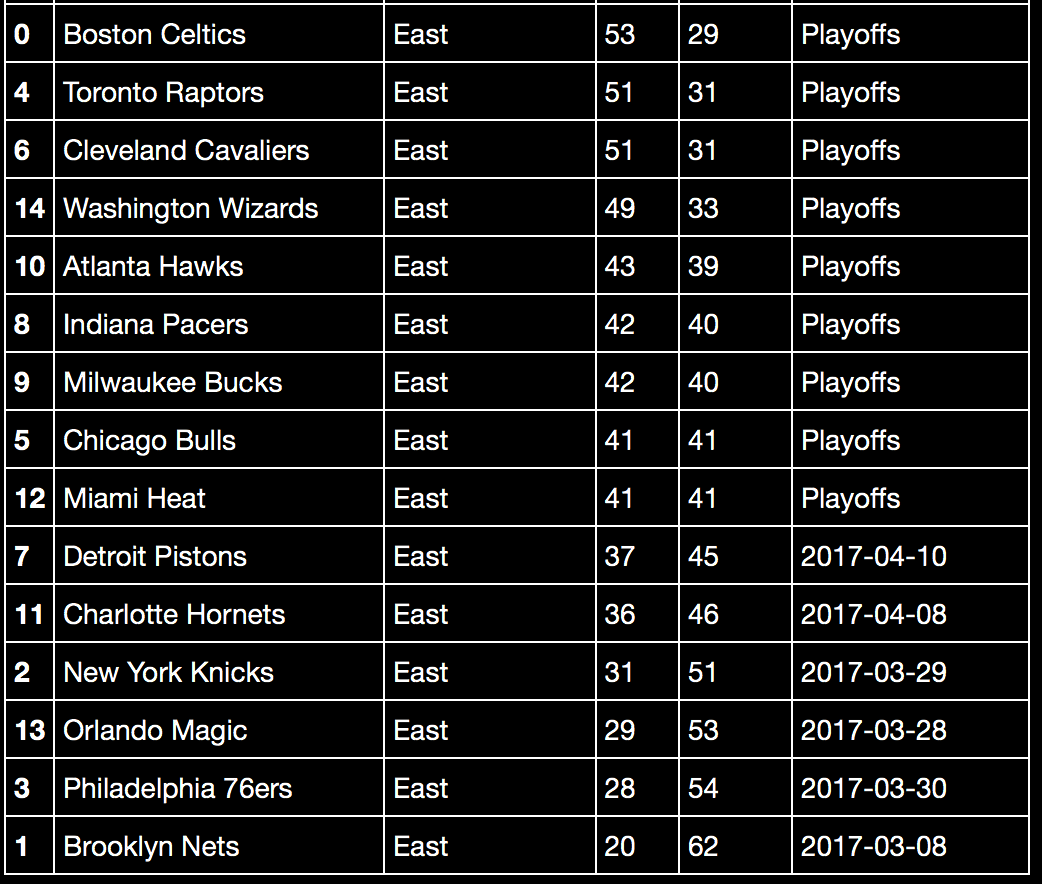
Based on the results I received, I believe my algorithm worked quite well. The only obstacle I failed to overcome was resolving tiebreakers. This year, the Chicago Bulls and the Miami Heat tied for the eighth seed in the Eastern Conference. In reality, the Chicago Bulls broke the tie by having a better conference record. However, my program only tracks the raw win-loss record, not conference or home wins and losses, so the Bulls and Heat are listed as both making the playoffs. In addition, the ties between the Cleveland Cavaliers - Toronto Raptors and LA Clippers – Utah Jazz are suspect to being in the wrong order. The NBA rule book features a series of criteria for tiebreakers, including head to head records, division / conference win percentages, and win/loss percentages versus conferences. Implementing these tiebreakers would require creating additional columns to store the aforementioned statistics.